
On this page
Predictive Analytics in Spare Parts: Case Studies
Managing spare parts effectively can save millions. Predictive analytics transforms inventory management by using historical data and machine learning to forecast demand, reduce shortages, and lower costs.
Key Insights:
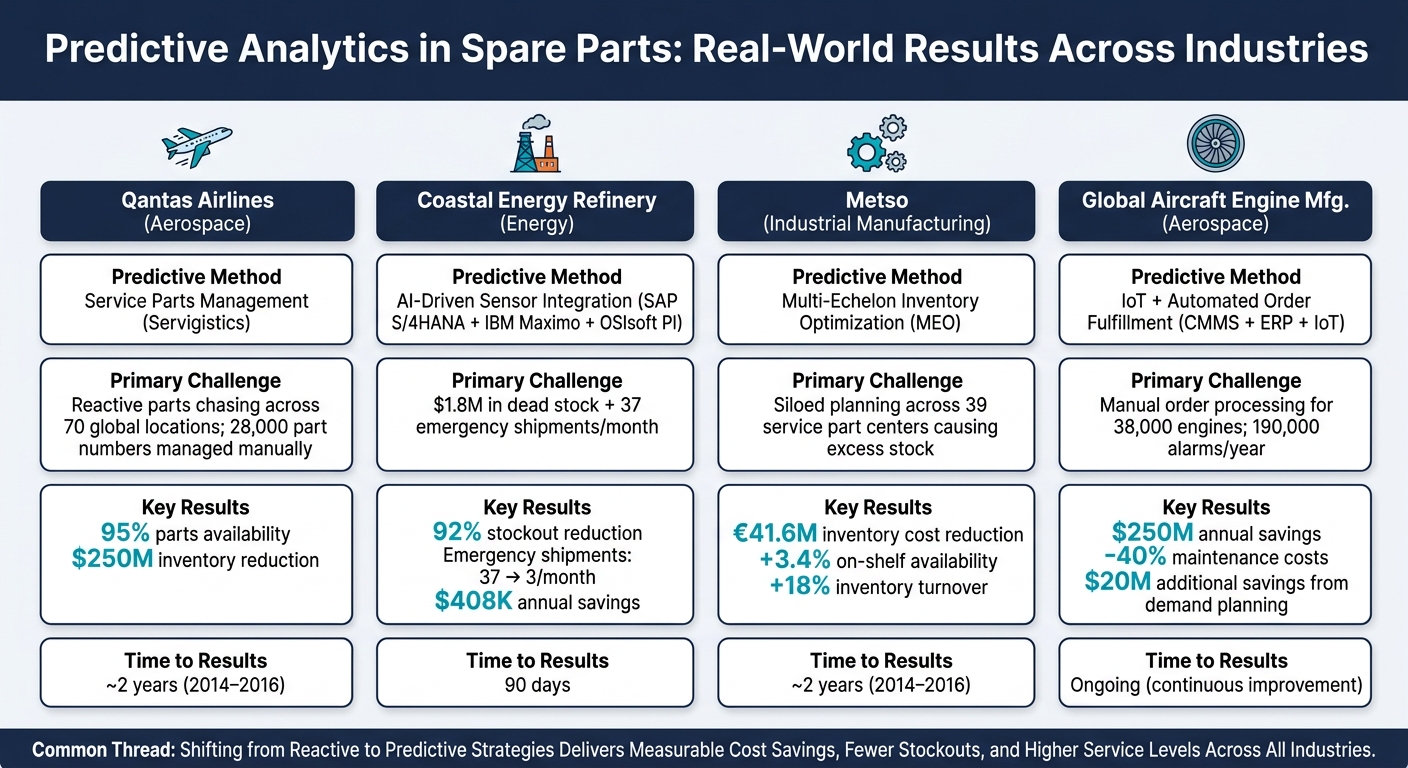
- Qantas Airlines: Saved $250M by improving parts availability to 95% and reducing inventory waste.
- Coastal Energy Refinery: Cut stockouts by 92% and emergency shipments from 37 to 3 per month, saving $408K annually.
- Metso: Reduced inventory costs by EUR 41.6M and improved turnover by 18% using network-wide optimization.
- Aircraft Engine Manufacturer: Saved $250M annually by integrating IoT sensors with inventory systems to pre-plan maintenance parts.
Why It Works:
- Predictive tools analyze demand patterns, sensor data, and supply chain risks.
- Automated systems adjust safety stock and trigger orders in real-time.
- Integration with ERP systems ensures smooth operations and accurate forecasts.
By shifting from reactive to predictive strategies, companies are reducing downtime, improving service levels, and cutting costs.
Case Study 1: Demand Forecasting for Accurate Replenishment
For many spare parts operations, the challenge is not the absence of data - it is the fact that the data is unstructured. This makes it extremely difficult to ensure accurate replenishment.
The Problem
Qantas Engineering faced the daunting task of managing 28,000 component part numbers and 60,000 expendables across 70 global locations. Their processes were largely manual, and visibility was fragmented. Inventory decisions were reactive, relying on replenishing items that had already run out instead of anticipating future needs.
“The planning team did not have faith in the tool and recommendations and would manually control inventory. We needed a user-friendly tool.” - Justin Pollard, Supply Chain Team Lead, Qantas Airlines
The Predictive Analytics Solution
To tackle these inefficiencies, Qantas introduced a predictive analytics solution. Beginning in 2014, they implemented PTC’s Servigistics software to replace manual inventory planning with a data-driven approach. The process started with data sanitization to ensure accurate demand modeling. Parts were categorized based on their criticality and failure rates, which improved forecast precision. This segmentation aligned perfectly with predictive analytics’ aim to minimize lead times. The platform also provided visibility across all 70 locations, transforming isolated stocking decisions into a cohesive, network-wide strategy.
Results
This proactive approach led to impressive outcomes:
- Achieved a 94% parts availability rate by 2016
- Reduced spare parts inventory by $250 million
But the benefits went beyond just numbers. The team shifted from constantly reacting to shortages to planning ahead - a change in mindset that proved just as transformative as the financial savings. This success paved the way for even more advancements in inventory forecasting.
Case Study 2: Cutting Stockouts with Predictive Alerts
Stockouts often start as small signals - like sensor anomalies, supplier delays, or technician discussions - that escalate over time. The challenge is catching these early signs before they turn into major supply gaps.
Spotting Risk Signals Early
The Coastal Energy Refinery faced a tough situation: $1.8 million tied up in dead stock while still running into frequent parts shortages. To tackle this, they implemented an AI-driven predictive inventory platform that integrated data from SAP S/4HANA, IBM Maximo, and OSIsoft PI sensors. This system analyzed relationships across 12,000 data points, constantly scanning for potential issues. By using plain language queries like “flag bearings at risk of stockout in Q3,” refinery staff received prioritized reorder plans.
The system did not just stop there. It also tracked external factors like extreme weather and regulatory changes. Even technician forums were monitored using natural language processing (NLP) to catch early reports of part failures that had not been officially logged. These insights allowed the refinery to act quickly and avoid disruptions.
Steps Taken to Prevent Stockouts
Once risks were identified, automated processes kicked in immediately. For instance, if the system detected a potential shortage, it triggered procurement rules like, “Auto-create SAP PO when Pump P-17 seal stock drops below 15 units.” This eliminated delays between identifying a risk and placing an order. Safety stock levels were also adjusted dynamically, based on real-time consumption and risk simulations.
A similar strategy was adopted by CNH Industrial’s Zedelgem plant in Belgium, which manages 30,000 parts. They used a four-step process - Quantify, Estimate, Simulate, Optimize - to continuously update stock targets. This replaced manual safety stock management and accounted for potential delivery delays and demand fluctuations.
“This solution helps us to transition from a reactive to a more proactive approach. In this way, shortages of stock at the production line can be mitigated before they ever occur, rather than merely preventing a recurrence.” - Pieter De Pourcq, Operational Excellence and Business Transformation Manager, CNH
Improvements in Service Levels
The results were striking. At Coastal Energy Refinery, stockouts dropped by 92% in just 90 days. Emergency air shipments plummeted from 37 to only 3 per month, saving $408,000 annually. CNH Industrial also saw big wins, with more than a 50% reduction in missing parts on production lines and a 10% cut in express delivery costs.
“Superlinear… remained focused on our primary objective: reducing costs associated with missing parts and avoiding express transport expenses.” - Lies Pierloot, Manufacturing Value Chain Logistics Engineering, CNH
Case Study 3: Balancing Inventory Across Multiple Locations
Distribution Challenges
Managing inventory independently at multiple warehouses often causes major inefficiencies. Some locations end up overstocked, while others face shortages, creating a ripple effect of emergency stock transfers and supply chain disruptions. This was a challenge for Metso, a global manufacturer of industrial equipment, across its 39 service part centers. Their isolated approach to inventory planning resulted in excess stock and inconsistent service levels. Sebastien Berge, Manager of Services, Global Process Development at Metso, highlighted the issue:
“We couldn’t look at our supply chain as a network of independent locations anymore, it’s not the most optimal for our customers. We have to have parts available at the correct place and at the correct time.”
Using Analytics to Distribute Inventory
In June 2014, Metso began revamping its parts network with the help of PTC’s Servigistics platform. By October 2015, they had integrated Multi-Echelon Inventory Optimization (MEO) into the system. This technology shifted their focus from managing individual warehouses to optimizing the entire network. MEO uses factors like demand probability, lead times, and each location’s role to determine the ideal stock levels at every site.
The system also connected seamlessly with Metso’s global SAP ERP, automating stock transfers from overstocked to understocked locations. This automation is most effective when paired with strategies to speed up inventory intake at the warehouse level. Crucially, Metso used actual customer demand as the primary planning signal rather than relying on internal transfer orders. This approach minimized the bullwhip effect, where minor demand fluctuations can cause significant supply chain disruptions.
Results and Efficiency Gains
By embracing predictive analytics and network-wide planning, Metso achieved impressive results. Over two years, the company reduced inventory costs by EUR 41.6 million, increased on-shelf availability by 3.4%, and improved inventory turnover by 18%.
| Company | Locations | Key Outcome |
|---|---|---|
| Metso | 39 part centers | EUR 41.6M inventory reduction; 18% higher turns |
| Qantas Airlines | 70 global sites | $250M inventory reduction; 95% availability |
| GE Power | 130 countries | 25% lower inventory; 97% service levels |
Case Study 4: Planning Spare Parts Around Maintenance Schedules
Connecting Maintenance Data to Inventory Planning
Integrating real-time maintenance data with inventory planning takes predictive analytics to the next level. Spare parts often show early signs of failure - like unusual vibrations, temperature changes, or wear patterns - that can be detected by sensors. The key challenge is turning these sensor signals into actionable inventory decisions.
A global aircraft engine manufacturer tackled this issue by combining IoT-based predictive maintenance with its order fulfillment system. Managing a fleet of 38,000 engines and analyzing approximately 190,000 operational alarms annually, the company feeds real-time sensor data into its spare parts planning. This system allows them to predict which parts will be needed, where, and when - shifting from a reactive approach to a proactive one.
“By integrating predictive maintenance plans into its order management and fulfillment processes it would be better able to predict which parts would be necessary where and when.” - Genpact
Pre-Positioning Parts Before They Are Needed
Predicting a part’s failure is only half the battle - ensuring the replacement part is at the right location is equally critical. To achieve this, the manufacturer linked its Computerized Maintenance Management System (CMMS) with its ERP and IoT sensor networks. This integration automates the ordering process: when predictive models identify an impending failure, purchase orders are triggered automatically. By removing manual steps, the company streamlined its inventory management and ensured that spare parts are pre-positioned ahead of scheduled maintenance. This proactive approach transformed operations, reducing downtime and improving efficiency.
Outcomes
The results of integrating predictive maintenance with inventory planning speak for themselves. The company achieved a $250 million annual savings by reducing flight delays and cancellations. Additionally, maintenance costs dropped by 40%, and improved demand planning contributed another $20 million in yearly savings.
“The predictive maintenance improvements have reduced engine downtime and enabled better parts planning, saving the firm $250 million each year through fewer delays and cancellations.” - Genpact
This case highlights how linking maintenance schedules with inventory systems can deliver significant benefits. When data flows seamlessly between systems, spare parts are available when needed, and unplanned downtime becomes a rarity rather than the norm.
Comparing the Case Studies
Comparison Table
Here is a closer look at how predictive analytics reshaped spare parts planning across different industries. The table below highlights the key aspects of each case study:
| Case Study | Industry | Predictive Method | Primary Challenge | Key Result |
|---|---|---|---|---|
| Qantas Airlines | Aerospace | Service Parts Management (Servigistics) | Reactive “chasing” of parts across 70 locations | 95% parts availability; $250M inventory reduction |
| CNH Industrial | Agriculture | 4-Step Simulation & Optimization | Manual safety stock for 30,000 parts; high express costs | >50% fewer missing parts; >10% lower express delivery costs |
| Coastal Energy Refinery | Energy | AI-Driven Sensor Integration | $2.3M in obsolete inventory; 37 emergency shipments/month | 92% stockout reduction; $408,000 in annual savings |
| Global Aircraft Engine Mfg. | Aerospace | IoT & Automated Order Fulfillment | Flight delays; manual order processing for 38,000 engines | $300M in supply chain efficiencies; $250M annual savings |
While the industries and challenges vary, the underlying transformation is consistent: moving from manual processes to predictive, data-driven strategies delivers measurable improvements across the board.
Key Takeaways
In every case, the shift from reactive problem-solving to proactive planning delivered substantial operational and financial gains. A major factor in this transformation was the focus on data quality and seamless integration with ERP systems. For instance, Qantas Airlines prioritized cleaning its master data to enable accurate forecasting, while other companies integrated tools like SAP and IBM Maximo to streamline operations.
The financial results also highlight where companies saved the most. Coastal Energy significantly reduced emergency shipments, cutting them from 37 per month to just 3. Meanwhile, the aircraft engine manufacturer minimized costly flight delays and cancellations. Though the sources of savings differed, the common thread was clear: earlier demand visibility led to more cost-effective fulfillment.
These examples illustrate how predictive analytics not only improves inventory accuracy but also reduces lead times, providing tangible benefits across a variety of industries.
Data and Implementation Requirements
Data Inputs You Need
Accurate and well-organized data is the backbone of predictive analytics. To get started, you will need 5-7 years of historical demand data, standardized part metadata, maintenance logs, and real-time supply chain data like supplier lead times and current stock levels.
Sensor data from equipment telemetry is equally important. Details such as vibration levels, temperature changes, and operating hours provide early warning signs for potential part failures. Here is a quick breakdown of the essential data inputs, their sources, and why they matter:
| Data Input | Source System | Why It Matters |
|---|---|---|
| Historical Consumption | ERP (e.g., SAP, Oracle) | Identifies seasonal and intermittent demand patterns |
| Equipment Telemetry | Sensor Networks (OSIsoft PI) | Predicts part fatigue from vibration and temperature trends |
| Maintenance History | CMMS (e.g., IBM Maximo) | Links failure rates to specific equipment hierarchies |
| Supplier Lead Times | Supplier Portals (e.g., Ariba) | Optimizes reorder points to prevent stockouts |
Standardizing this data is just as important as collecting it. For example, recording parts under plant-specific material numbers instead of a universal manufacturer part number can skew forecasting. Cleaning and aligning data across systems is a must.
Once you have gathered and organized your data, the next step is to integrate it seamlessly into your ERP and inventory systems.
Integrating with ERP and Inventory Systems
Predictive tools do not replace your ERP - they work alongside it. The best solutions integrate directly with platforms like SAP S/4HANA for inventory and procurement, IBM Maximo for maintenance data, and IoT systems like OSIsoft PI for sensor feeds.
Take Coastal Energy Refinery as an example. Their team connected these systems in just 14 days, allowing their AI platform to automatically generate SAP Purchase Orders when stock levels hit critical thresholds. This integration reduced their procurement workload by 70%, with 85% of purchase orders being automated.
“The new logistics forecast was then integrated into the customer’s existing SAP ERP and BW systems. This protects the investment with respect to the existing systems and reduces the effort of process integration.” - Zoi Case Study
Adopting a phased rollout approach can make this process more manageable. Starting with demand forecasting before moving on to automated replenishment gives teams time to adapt and learn without feeling overwhelmed.
Once integrated, these systems lay the groundwork for automation tools that simplify data preparation.
How Automation Tools Support Data Preparation
Even with the right systems in place, cleaning and structuring inventory data can still be a major hurdle. Nestle USA tackled this challenge in March 2026 by deploying AutomaSnap’s AI-enabled tool across its factory network, integrated with SAP. This tool automated duplicate detection and created part descriptions, eliminating the need for manual searches.
“The parts’ inventory got a structured makeover, focused on data standardization and workflow simplification with the help of an AI-enabled tool integrated with SAP.” - Anna Townshend, Managing Editor, Plant Services
For companies managing physical inventory, AutomaSnap offers a game-changing solution. By extracting details like brand, MPN, and serial numbers directly from nameplate photos, it generates ERP-ready spreadsheets compatible with systems such as SAP, Odoo, and Dynamics 365. This eliminates manual transcription and provides structured, photo-verified data that supports reliable predictive models from the start.
Conclusion and What Comes Next
Key Benefits at a Glance
The case studies discussed here paint a clear picture: predictive analytics is transforming spare parts management into a proactive, deliberate process. The real-world results speak volumes, showing measurable improvements across critical metrics:
| Metric | Real-World Result |
|---|---|
| Inventory reduction | $250M saved by Qantas; dead stock cleared by Coastal Energy Refinery in just 90 days |
| Stockout frequency | 92% drop; emergency shipments reduced from 37 to 3 per month |
| Missing parts on production line | More than 50% reduction at CNH Industrial’s Zedelgem plant |
| Procurement workload | 70% cut thanks to automated purchase orders |
| Forecasting error | 50% decrease for a major automotive manufacturer |
Beyond these numbers, predictive analytics is reshaping organizational culture. Teams are transitioning from scrambling to address shortages to confidently planning ahead. This shift not only improves efficiency but lays the groundwork for even more advancements in the future.
Where Predictive Analytics Is Headed
The success highlighted in these case studies is fueling the next stage of innovation. Companies that once relied on reactive processes are now embracing more advanced capabilities, including:
Agentic AI: This technology goes beyond traditional dashboards, allowing teams to use plain-language prompts to identify stockout risks or trigger reorders automatically - no technical expertise required.
Deeper IoT Integration: Real-time data from sensors monitoring vibration, temperature, and operating hours will feed directly into replenishment models. This minimizes the delay between identifying an issue and ensuring the right part is available.
Network-Wide Collaboration: Companies like Qantas are expanding predictive analytics to include suppliers and customers, creating a shared understanding of risks across the supply chain. Terex Corporation is also preparing for this future. Dmitry Shurmin, Director of Global Forecasting, explains:
“We have to be as much predictive as we can manage inventory proactively. That becomes more critical on the earliest lifecycle phase when we need to prepare parts buffer even before the first machine sells.”
The organizations poised to gain the most are those investing in strong data foundations today. Clean master data, integrated systems, and standardized workflows are essential building blocks. Tools like AutomaSnap, which automates accurate inventory data capture, can further streamline these efforts, paving the way for even more advanced predictive analytics.
FAQs
What data do I need to start predictive analytics for spare parts?
To kick off predictive analytics for spare parts, you’ll need to gather reliable historical and operational data. Here is what to focus on:
- Spare parts usage records: Document details like which parts were used, when, and where.
- Machine usage data: Include metrics such as running hours, fuel consumption, and location.
- Item structures: Use resources like bills of materials or installed-base mappings to understand part relationships.
You can take it a step further by incorporating logistics KPIs and seasonal trends to improve your forecasting accuracy. Tools like AutomaSnap can make data collection easier by extracting structured part identifiers directly from nameplate photos.
How do predictive tools integrate with ERP and CMMS systems like SAP and Maximo?
Predictive analytics tools work seamlessly with ERP and CMMS systems by embedding forecasts and actionable recommendations directly into existing workflows and master data. Take SAP, for example - logistics forecasts were integrated into its ERP and BW systems, enabling efficient updates on a weekly basis. In maintenance operations, AI-powered spare-parts tools improved search precision and optimized inventory management. This was further supported by standardized data-entry processes across various facilities, ensuring consistency and efficiency.
How do I measure ROI from predictive spare parts planning (stockouts, downtime, inventory)?
To evaluate ROI effectively, tie improvements from predictive planning directly to financial and service KPIs. Focus on areas like inventory costs, which could include reductions in excess stock, safety stock, and emergency shipping expenses. Also, monitor results such as fewer stockouts or back orders and decreased penalties from downtime.
Here is how to approach it: Compare baseline metrics with post-deployment results over an equivalent cycle. This will help you clearly see the impact. Then, calculate the total savings and subtract both implementation and ongoing operating costs. The result? A straightforward way to gauge your ROI.